
Multisource IntegrationHarmonization of images, spectrographs, text, tables and experimental conditions
AI Multimodal Analysis
Multimodal Data Analysis
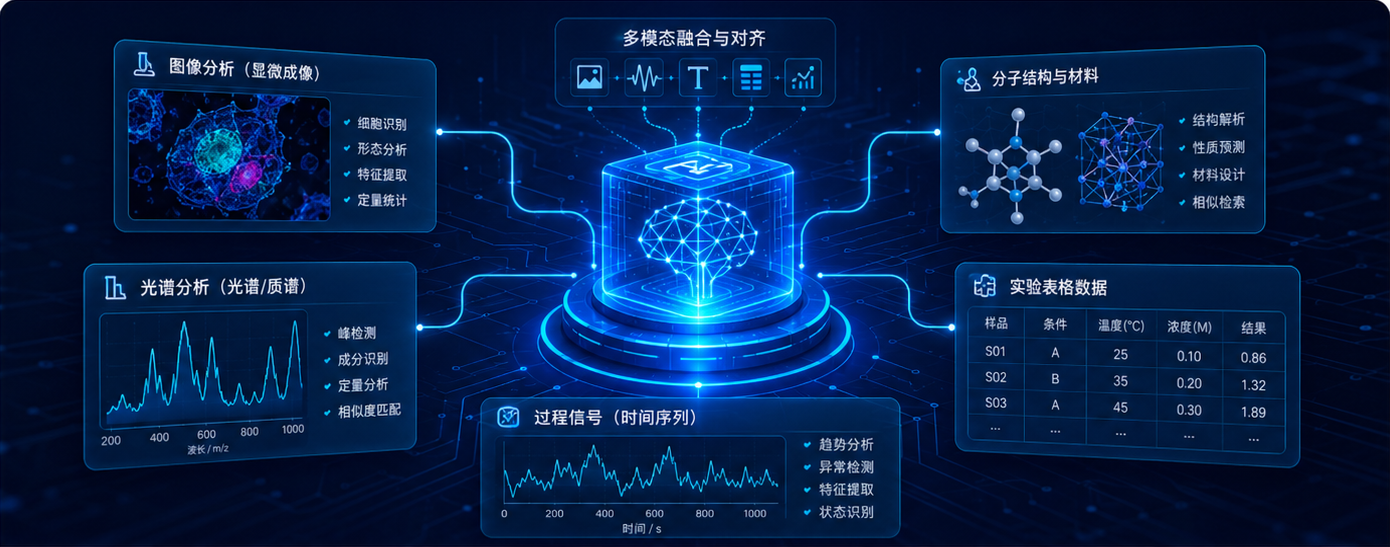
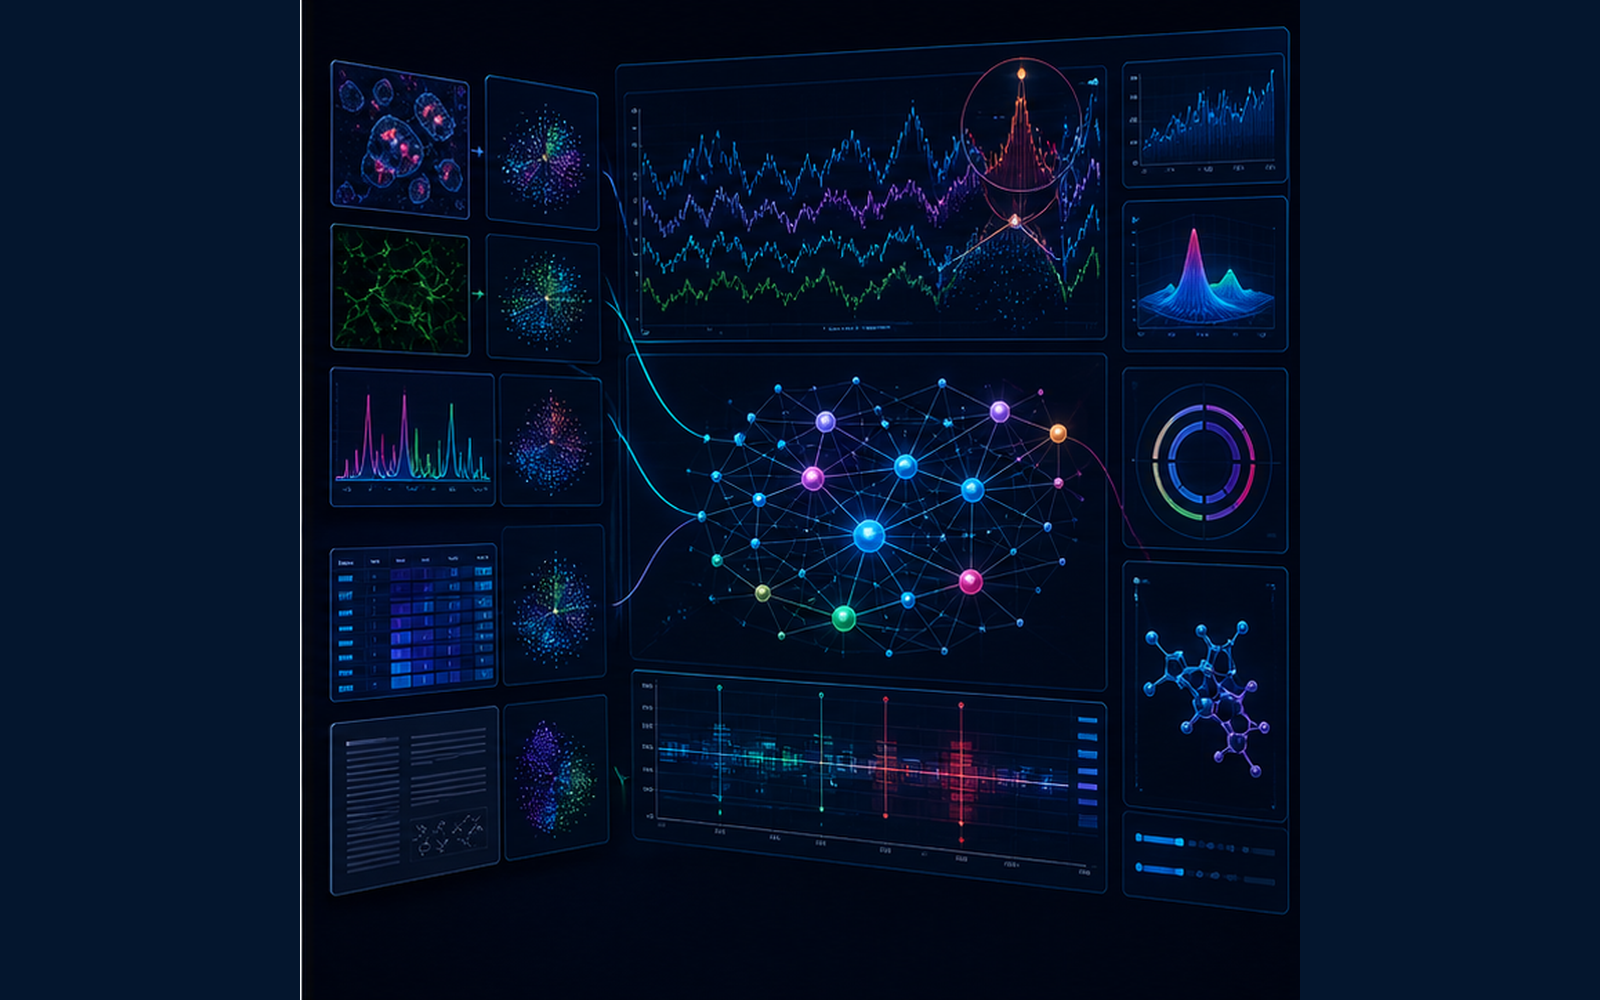
Integration of images, spectrographs, tables, text and experimental conditions and establishment of cross-modular analysis processes to assist scientific teams in detecting variable correlations, sample differences and interpretable patterns.
01
Solution Overview
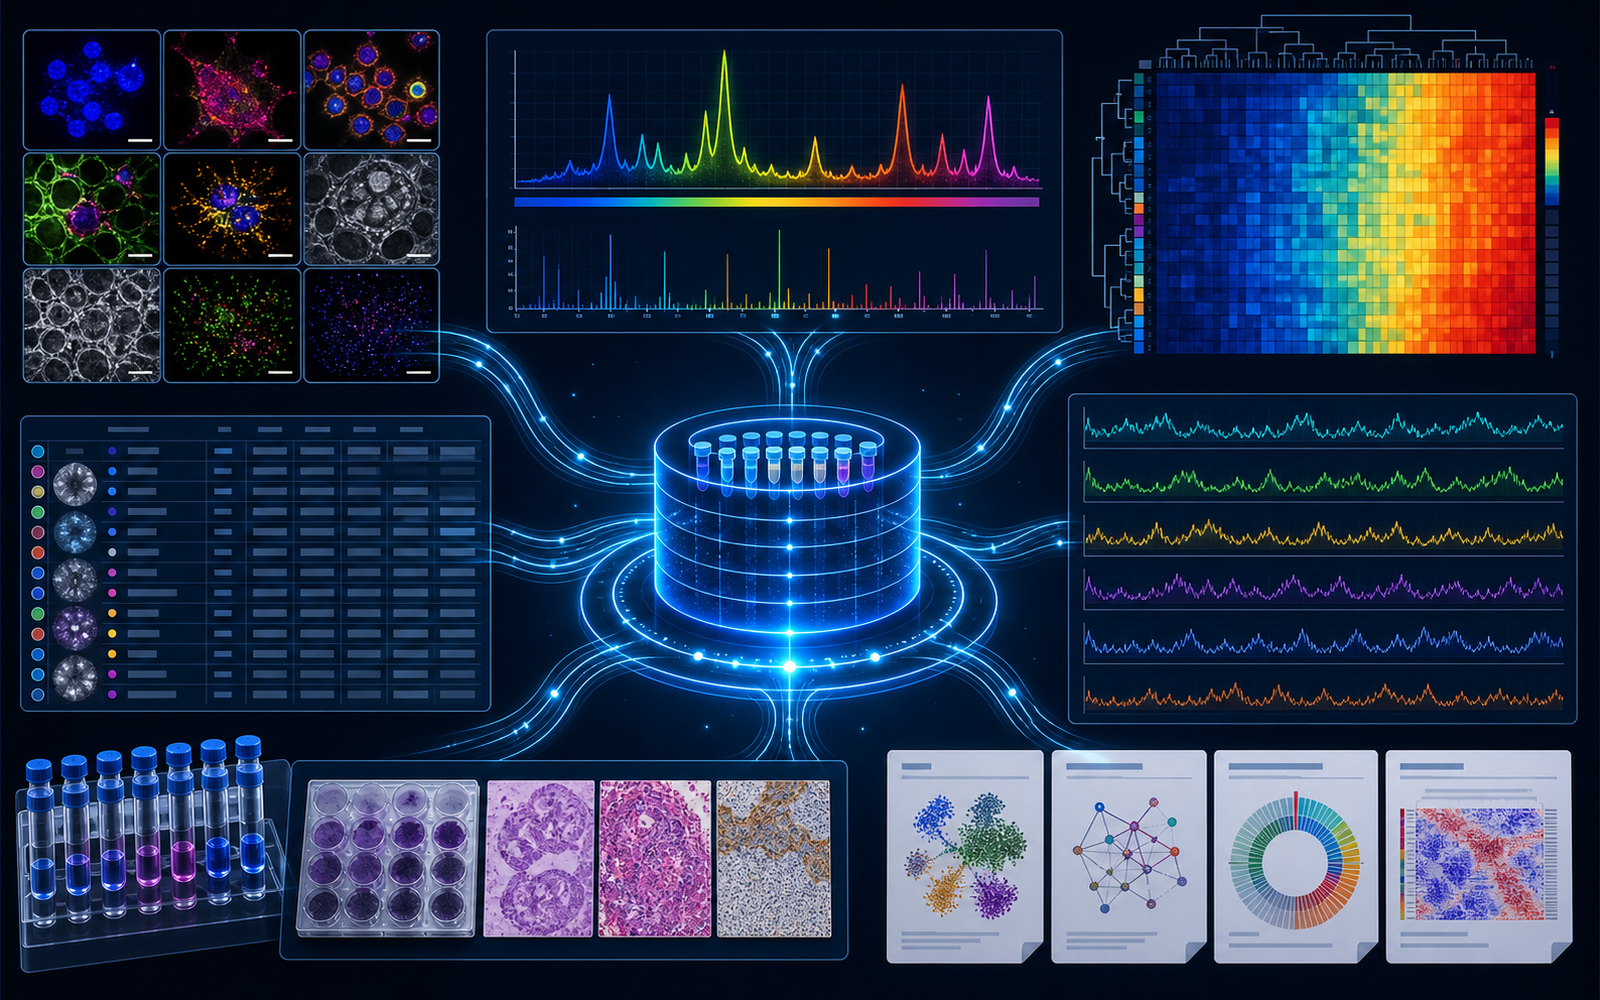
For materials, life sciences, medical images, micro-images, spectral data, test curves, experimental tables and report texts, clean, align, feature extraction and visualization of data from multiple sources. Explanatory drawings of conclusions and delivery reports are developed through statistical analysis, machine learning and multi-mode integration models.
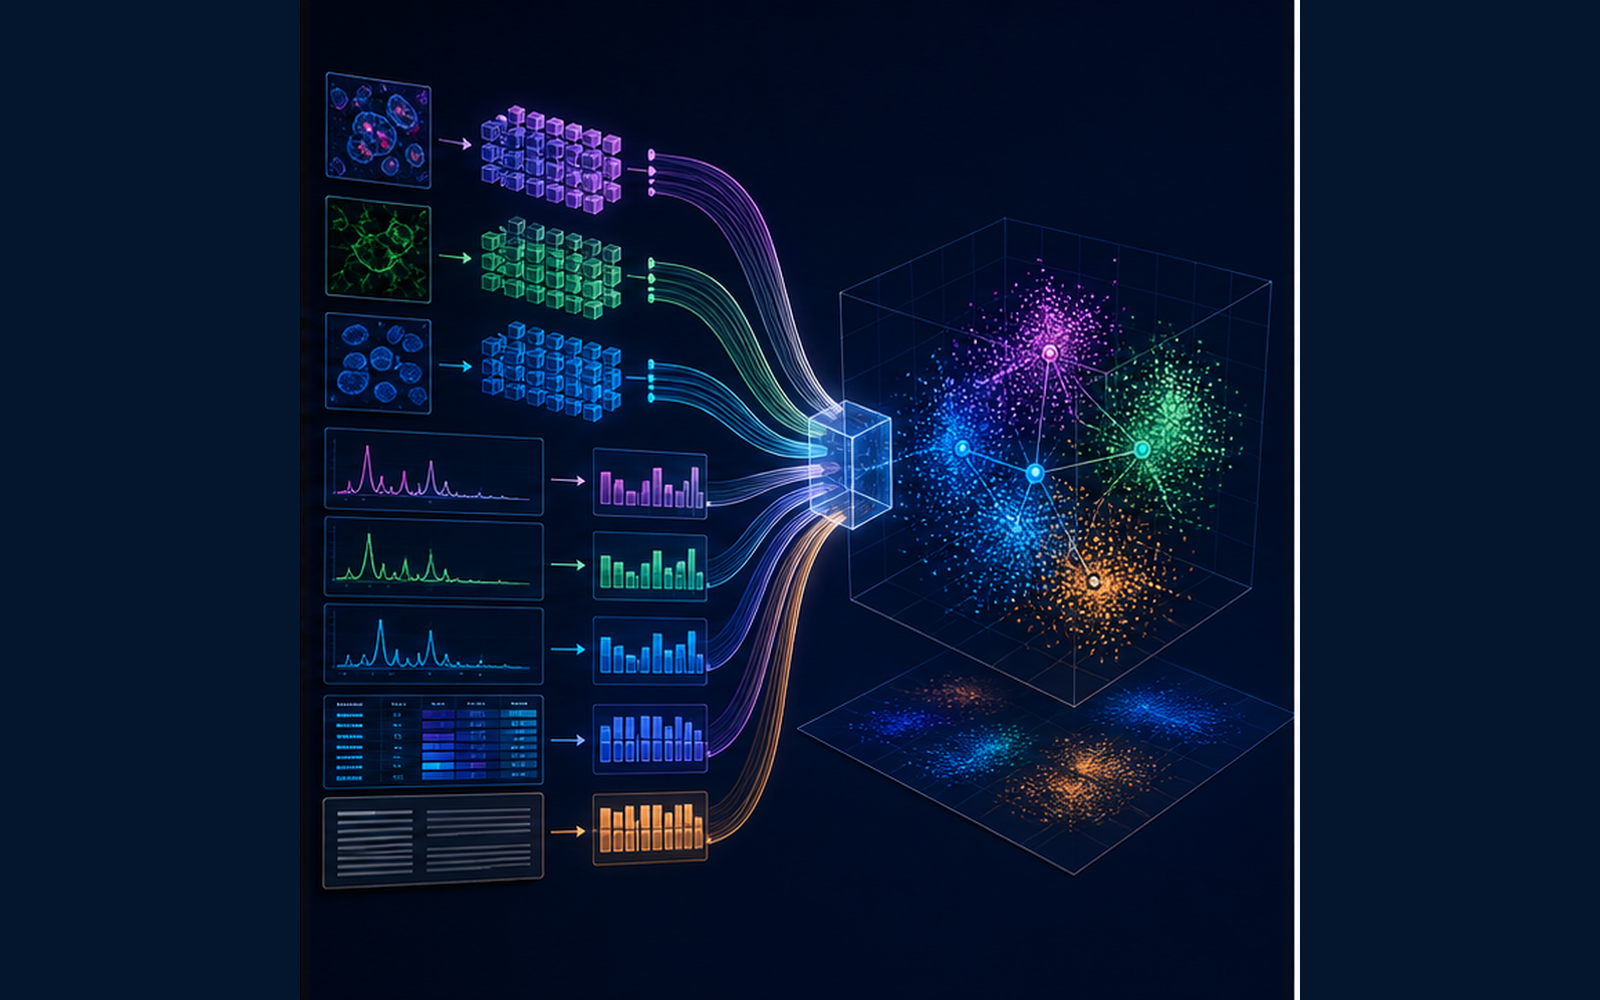
Feature extractionStripping, peaks, curves, semantics and statistical indicators
Linked InsightSample grouping, variable relationships and unusual sources detected
Visual outputForm charts, reports and interactive analysis panels
02
Applications
- Joint analysis of SEM, TEM, AFM, microimage and structural parameters
- XRD, XPS, FTIR, Raman, UV mass processing
- Harmonization of experimental conditions, sample numbers, test results and reporting text
- Finding the statistical relationship between material structure, preparation conditions and performance
- Visualized conclusions for paper charts, project reports and internal decision-making
03
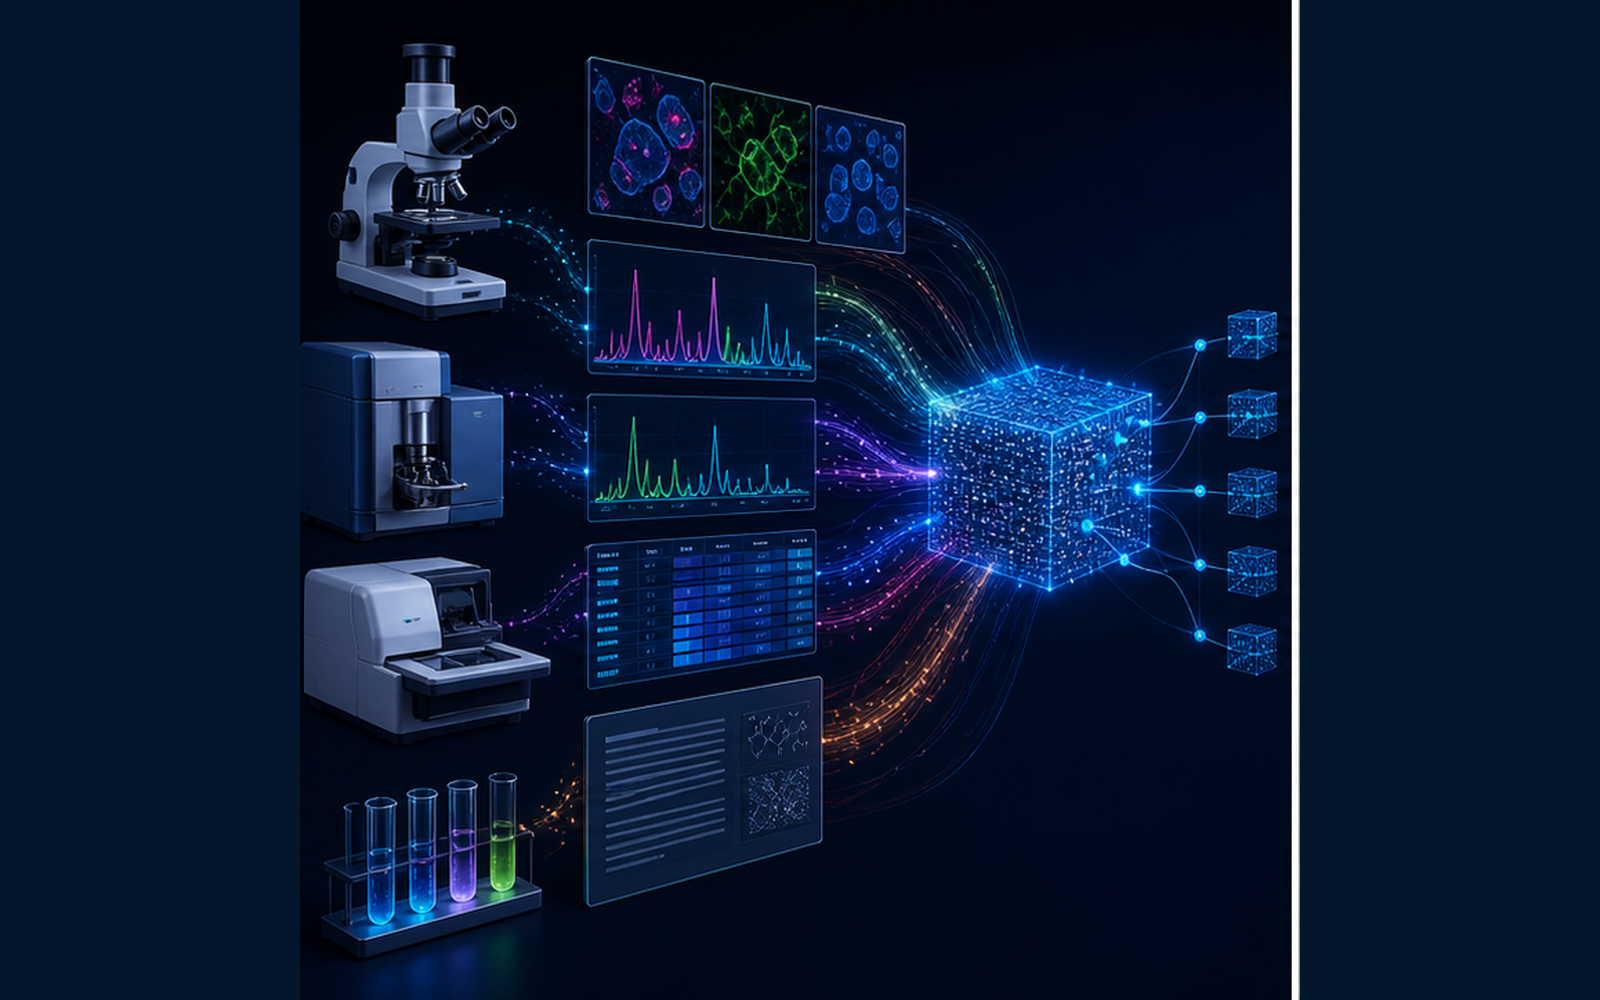
Overall process
File Structure
Quality control
Relationship Alignment
Relevant analysis
Explanation of results
Reuse Template
04
Technical modules
- Uniform sample index:Match images, spectrographs, tables and text with sample numbers and experimental batches.
- Image and spectroprocessing:Support division, peak recognition, curve alignment, noise reduction, homogenization and mass statistics.
- Characteristics integration:Combining shapes, spectropeaks, experimental conditions and performance indicators into modelable characterization tables.
- Explanatory analysis:Output key features, sample grouping, anomaly and variable association.
05
Project value
Get through the decentralized data.Co-comparison of data from different instruments and formats
Improved analytical efficiencyReduce manual preparation and repetition of graphics
Enhancing the credibility of conclusionsSupporting scientific judgement with statistical and interpretable models
Create a reuse processAdditional subsequent samples could follow the same treatment template
 AI / Simulation
 Characterization / Supplies